Comparing a multi-parameter polynomial regression approach to distance-based fuel burn estimators
Many stakeholders in the aviation sector are interested in understanding aircraft carbon emissions. For example, service-oriented corporations rely heavily on air travel, and airports are increasingly required to monitor flight emissions as part of the Airport Carbon Accreditation program.
A key input for estimating aviation CO₂ emissions is aircraft fuel burn. However, detailed fuel consumption data is confidential and typically owned by airlines. Publicly available information is therefore limited to open-source flight tracking data, such as aircraft position data obtained through ADS-B (Automatic Dependent Surveillance–Broadcast).
This raises an important question: can we develop reliable models to estimate flight fuel burn using only these publicly available data sources?

1. State of the art
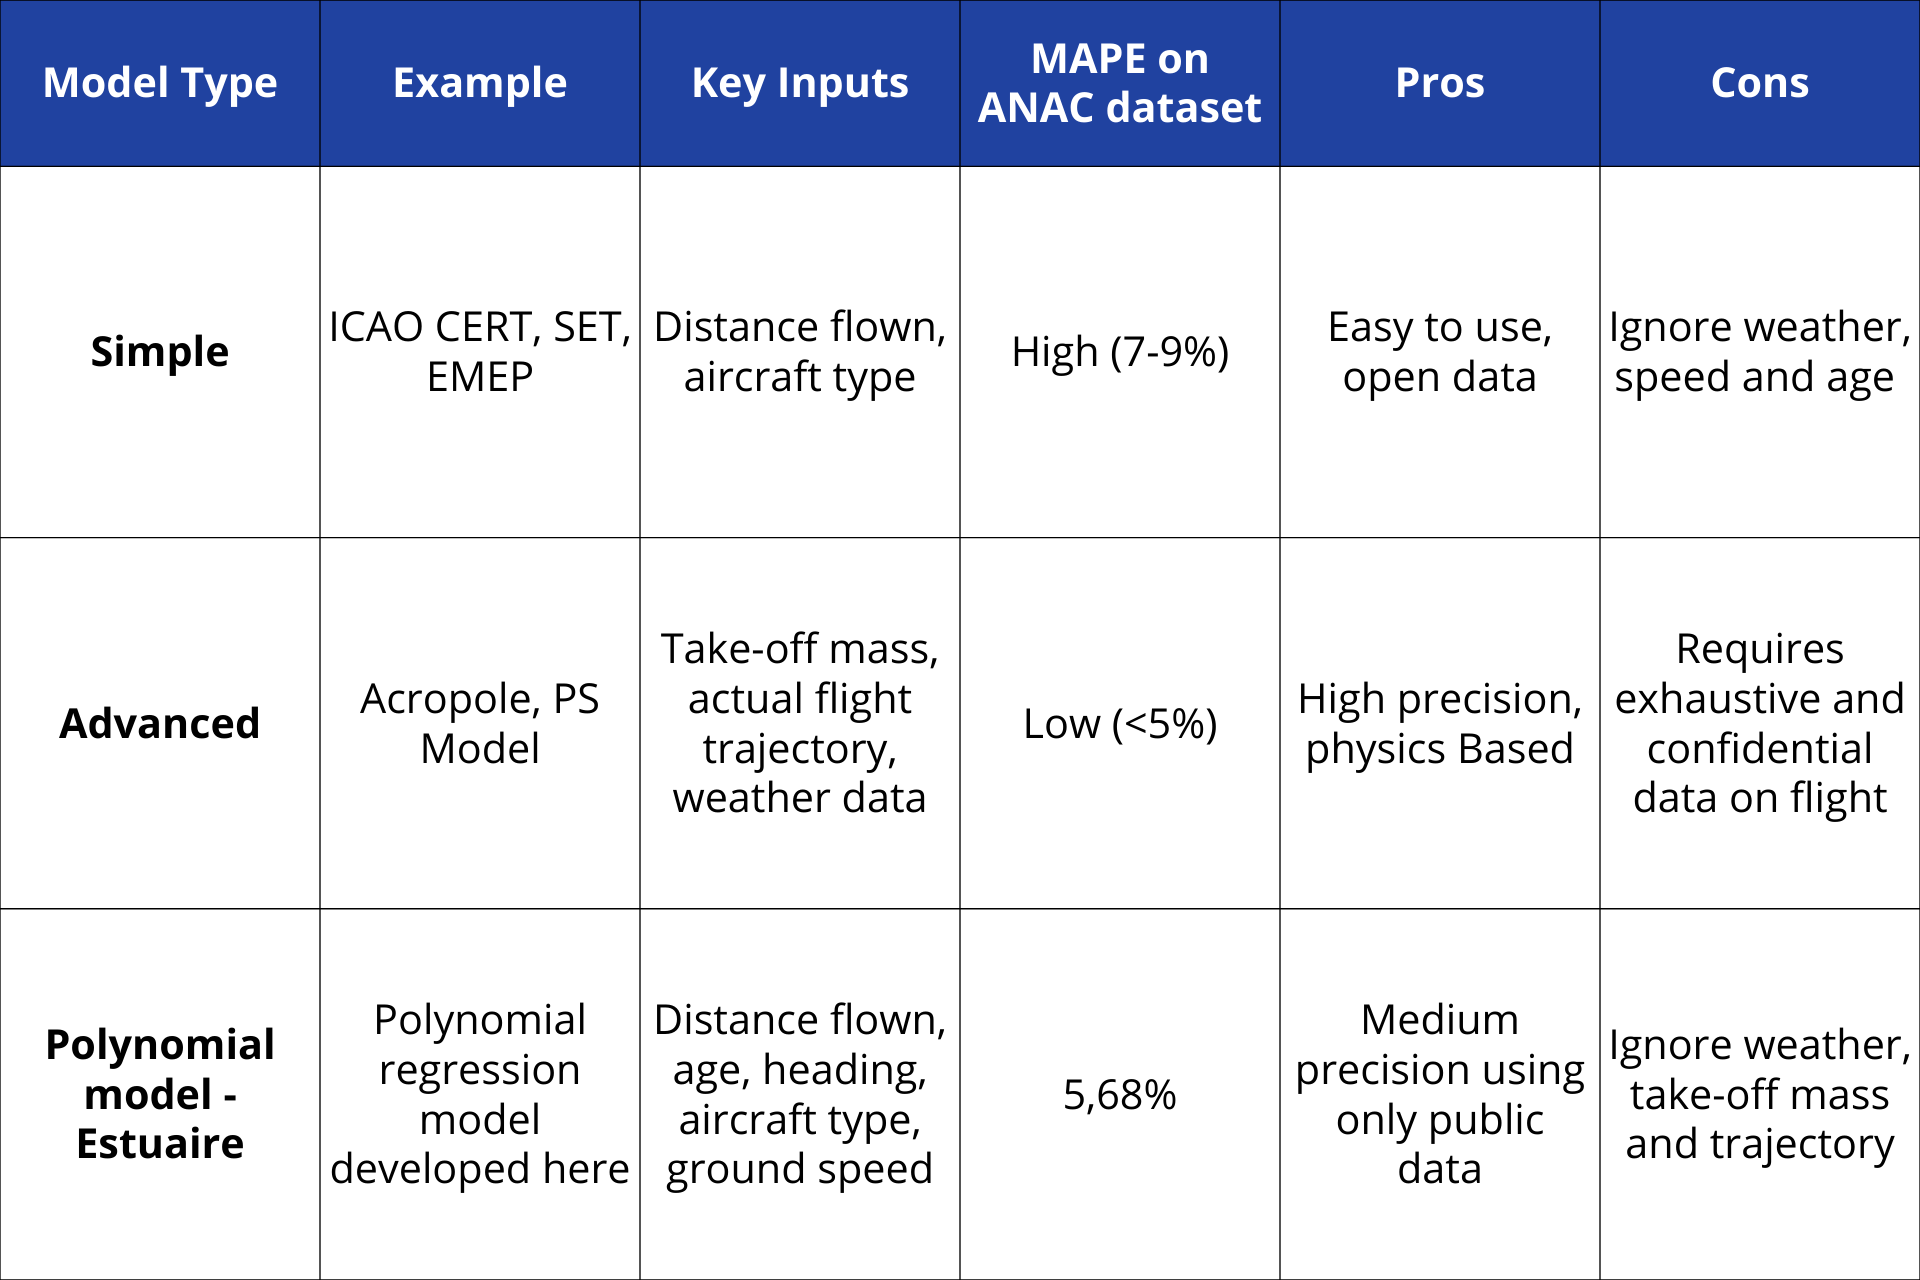
As of now, the industry relies on two main approaches to model fuel burn, both of which have limitations for widespread monitoring.
On one hand, advanced flight physics models estimate the main forces applied to an aircraft, such as lift, drag and thrust over the trajectory, to compute fuel burn. While these models are quite accurate, they are data-intensive. They require the full 3D trajectory of the flight, the weather observed at each waypoint and even the actual Take-off Weight, only known by the operating airline.
ADS-B data is one of the primary sources to retrieve flight trajectory information. This data relies on ground-based receiver networks, which are sparse over oceans and remote regions like the southern continents. These coverage gaps further limit the ability to use advanced flight physics models to compute fuel burn globally.
On the other hand, simpler fuel burn models such as EMEP, SET or ICAO CERT solely rely on Great-Circle Distance (GCD) and aircraft type. However, they tend to overlook factors such as wind, speed variability, and aircraft age, which can lead to inaccuracies. These factors all result from Airline fuel optimization policies as airlines consider their full cost base to determine whether pilots should speed up or rather favor fuel burn savings (see cost index).
2. Towards better flight emissions estimates using simple modeling
To bridge this gap between advanced flight physics models and simple distance-based models, Estuaire developed a Polynomial Regression model based on the main drivers of fuel burn : aircraft type, distance flown, average ground speed, aircraft age and heading. This model was trained on public flight data from the Brazilian National Civil Aviation Agency (ANAC).
The ANAC database compiles information on all flights departing and arriving in Brazil and notably aircraft ICAO code, registration, departure time, departure and arrival airports and fuel burn, starting from January 2019 to July 2025. To improve the results, we enriched ANAC data with Estuaire's proprietary database, in order to include the following variables:

- Precise aircraft type, to account for aircraft variants
- Aircraft age, to characterize the aircraft performance degradation over time
- Distance flown (km) from origin to destination airport, accounting for detours. This distance, along with take-off and landing times, allows to compute an average ground speed. One can wonder how ground speed might affect fuel consumption. A high ground speed can be attributed to favourable tail winds but also to a pilot throttling up to accelerate, thus burning more fuel
- Departure Heading angle of the flight, on a geodesic virtual track (in °, from North). The heading angle of the flight can be seen as a way to represent the direction of the flight (East/West, North/South). Intuitively, the idea is to characterize general wind patterns and their impact on flight duration. The most well-known phenomenon being the jetstream, that makes flights departing the USA to Europe fly at higher ground speed. The jetstram makes flights shorter in time hence burning less fuel for the same distance flown compared to flights from Europe to the USA.
Why a 2-degree polynomial regression ?
Fuel-burn doesn’t scale linearly with most of its drivers:
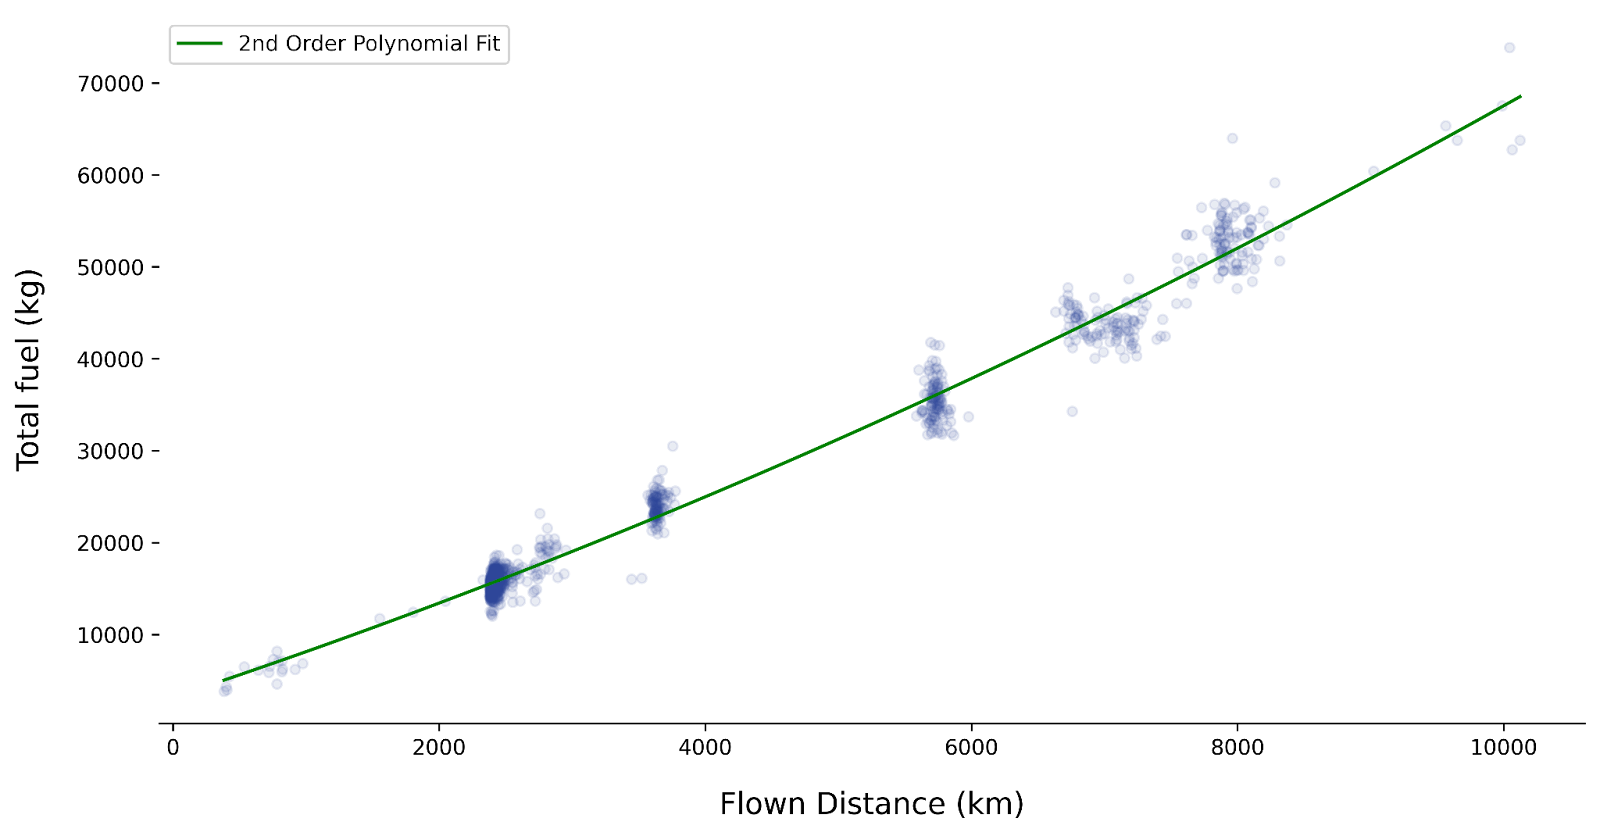
- As flight distance increases, airplanes burn more fuel, not only to cover the added distance, but also because the extra fuel required at takeoff increases their Take-Off Weight (TOW), which in turn further raises fuel consumption
- For a given set of atmospheric conditions, an increase in airspeed raises drag quadratically
The non-linear dependencies between all of these factors is also evident in ANAC data. Figure 1. illustrates fuel burn as a function of the distance, that showcases the non-linear relationship for longer flights. In a sense, a polynomial regression would intuitively fit better than a pure linear relationship.
These effects are accounted for in our Data Platform as we are using advanced flight physics models. They incorporate thrust-related fuel burn and the impact of tailwinds, using Numerical Weather Prediction (NWP) models to calculate wind conditions along the flight track, and an engine performance model to calculate the actual fuel flow of an aircraft. For a deeper dive into how NWP works, check out our latest article.
3. Model Performance
We trained our polynomial regression model on the ANAC dataset containing over 905,000 flights and validated its performance on an independent set of 226,400 flights. This train-test split ensures the model generalizes well to unseen data, an essential concept in data science.
We evaluated model performance using two key metrics: the Mean Average Percentage Error (MAPE), which measures relative accuracy, and the Mean Percentage Error (MPE), which identifies any systematic bias, such as a tendency to over or underestimate fuel burn. For benchmarking, we also compared our model’s performance against a publicly available legacy distance-based model. Results are depicted in Figure 2. and 3.
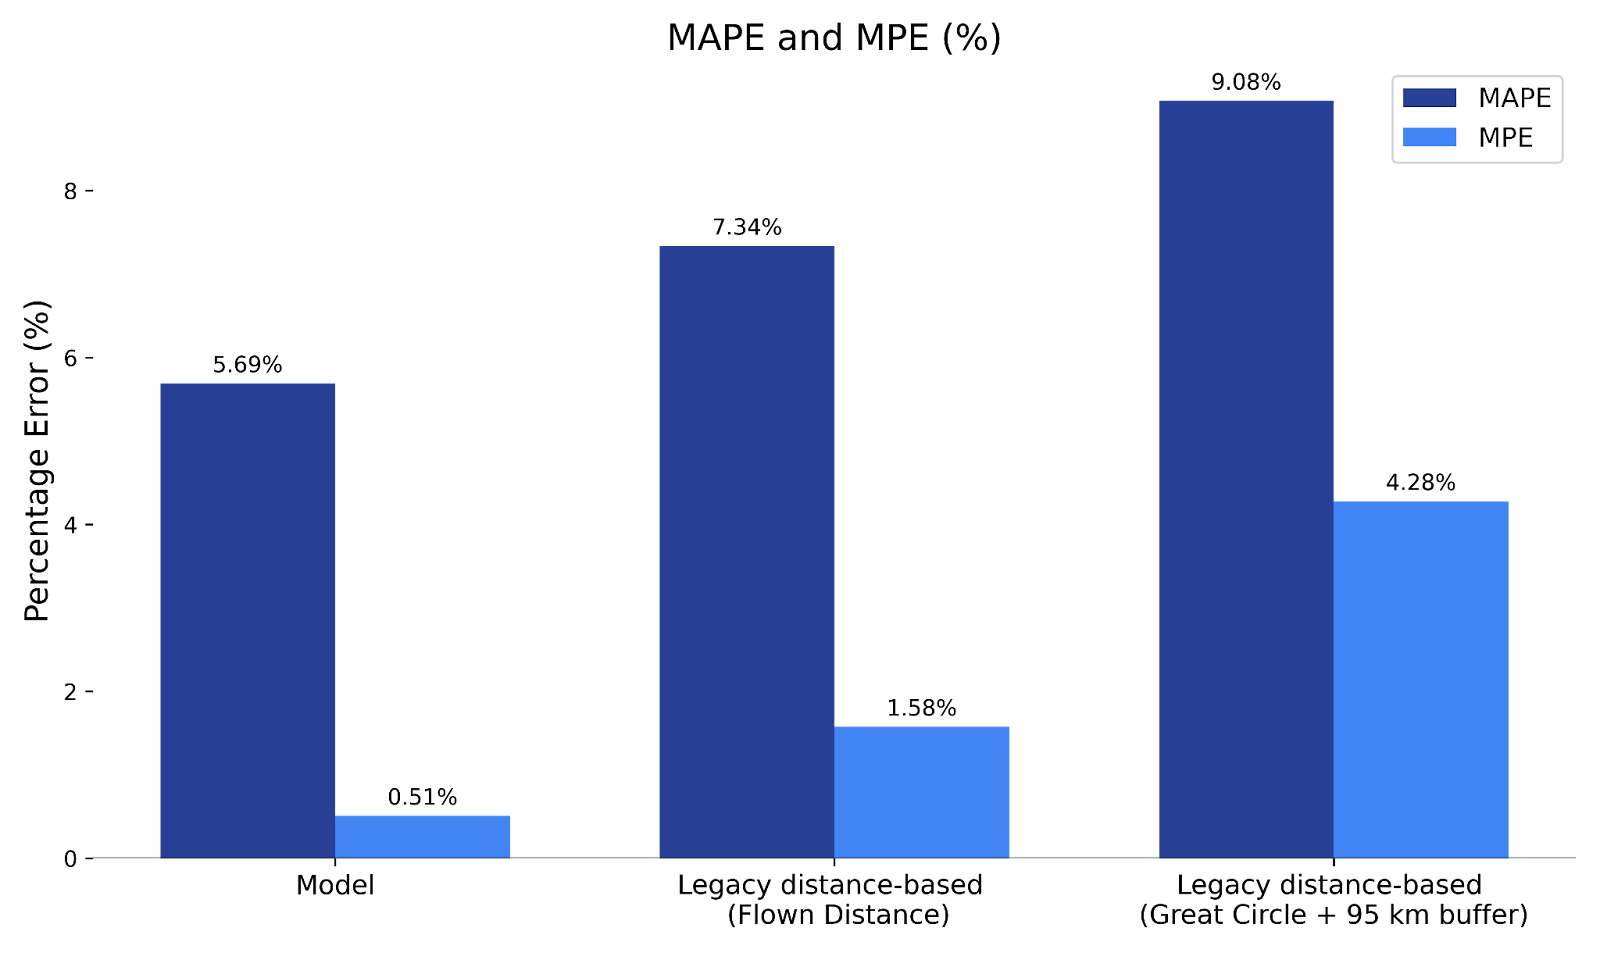
To interpret these results, it is necessary to understand the methodology behind distance-based fuel burn models. Distance-based fuel burn models rely on piecewise linear regressions using flown distance, typically approximated by the Great Circle Distance (GCD) between airports plus a 95 km buffer. While this approach is endorsed by ISO 14083 “Quantification and Reporting of GHG emissions in transport chains” to prevent under-reporting of emissions, it often leads to misestimation. The absence of variables like speed and aircraft age further increases error rates in real-world operations.
When looking at the most common narrow-body aircraft, the performance metrics can be further broken down:
- Airbus A320neo: 4.11% MAPE
- Airbus A320: 4.92% MAPE
- Boeing 737-800: 5.66% MAPE
All three major narrow-body aircraft types exhibit errors below 6% (MAPE). This level of accuracy makes the model suitable for flight-by-flight fuel consumption estimations in real-world aviation operations.
Conclusion and Future Perspectives
Replacing distance-based fuel burn models with a polynomial model brings the estimation closer to the actual physics of the flight. With average absolute errors below 6% for standard narrow-body aircraft, this method provides a practical way to estimate emissions using only public datasets. Future iterations will focus on data quantity and quality to further reduce the remaining margin of error and regional biases.
References
- Small Emitters Tool (SET): https://www.eurocontrol.int/tool/small-emitters-tool-set
- Acropole : https://github.com/DGAC/Acropole
- ISO 14083: Link
- ICAO CERT: https://www.icao.int/CORSIA/CERT
- PS Model Link
Key Acronyms
- ANAC: Agência Nacional de Aviação Civil
- EMEP: European Monitoring and Evaluation Programme
- CERT: ICAO CORSIA CO₂ Estimation and Reporting Tool
- GCD: Great-Circle Distance
- MAPE: Mean Absolute Percentage Error
- MPE: Mean Percentage Error
- MTOW: Maximum Takeoff Weight
- SET: Small Emitters Tool
.png)