As we approach the March 31st deadline for EU non-CO2 MRV Emissions Report submissions to the European Commission, the transition from CO2 tracking to full-spectrum climate accounting has moved to a present-day operational necessity.
Today, Estuaire is releasing its 2025 Contrail Opportunity Index, covering 38M flights operated throughout 2025. This global dataset allows the industry to access a global benchmark. But first, let’s understand the science behind the data.
CO2 emissions vs. Contrails
Flight trajectories were analyzed using ADS-B data and combined with high-resolution meteorological data from ERA5 (ECMWF). Contrail formation and radiative forcing were modeled using pycontrails (CoCiP). For each flight, contrail energy forcing was converted into CO2 equivalent using an efficacy-weighted GWP100 metric (aligned with EU MRV practices) with 42% efficacy based on Lee et al.
Our data reveals that the environmental impact of aviation is far more complex than just jet fuel burn. For the 2025 analysis period, we recorded:
- 975 MtCO2 in direct aviation emissions.
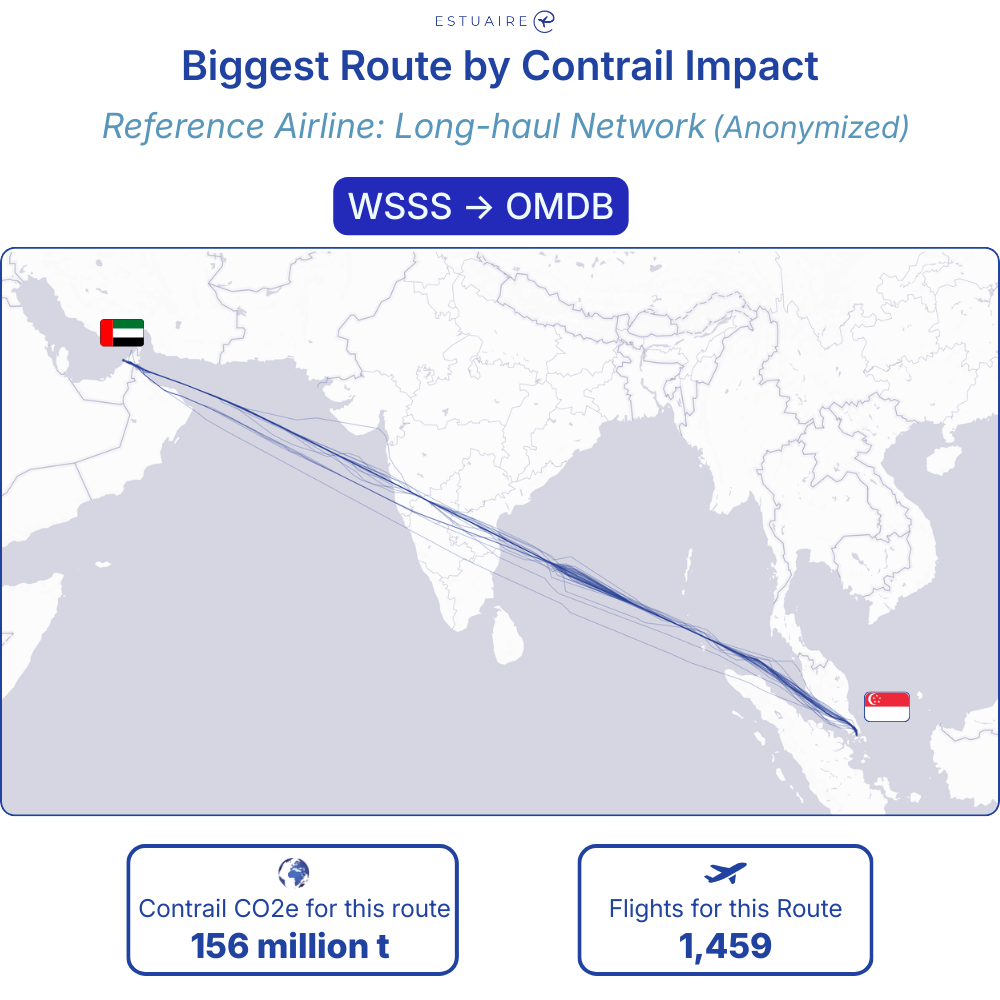
- 156 MtCO2e in additional warming impact from contrails.
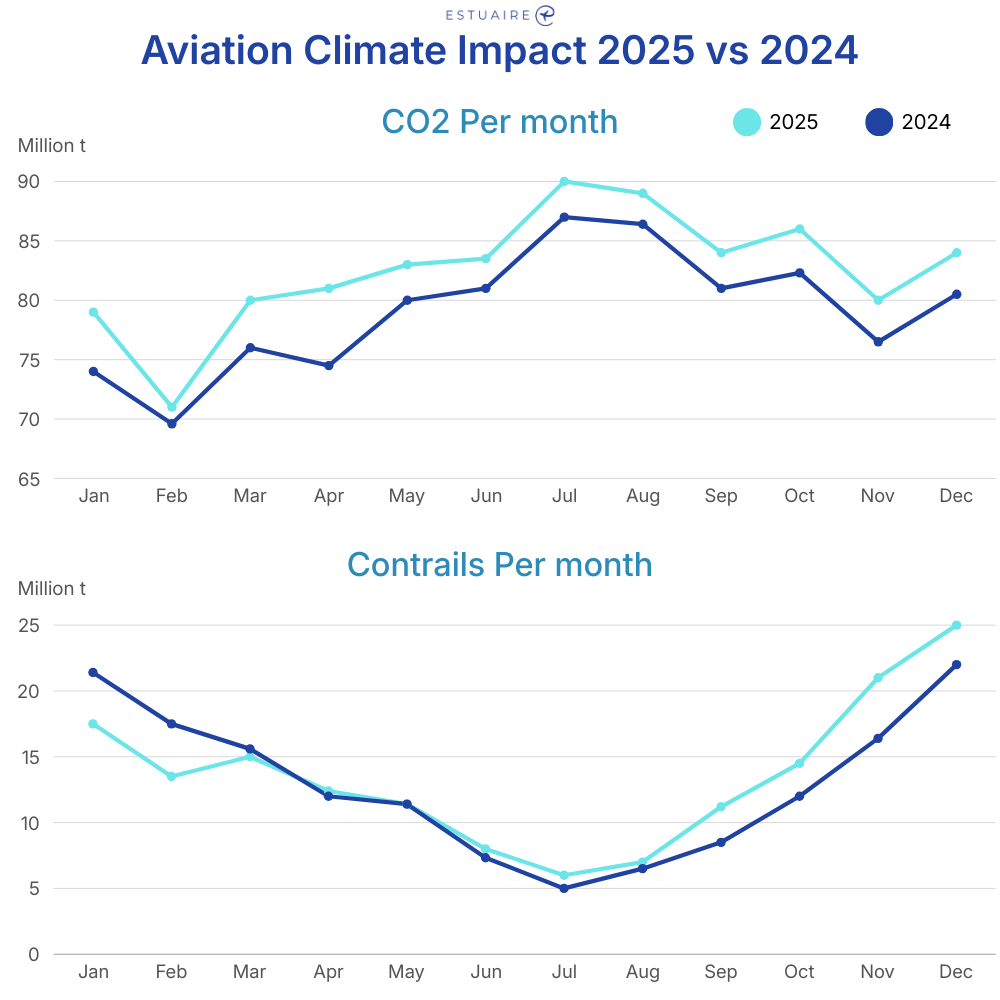
By adopting a detailed flight-by-flight analysis, we’ve moved away from averages to compute the climate impact of each specific flight trajectory. This includes variables like flight timing, location, seasonal variations, and even specific engine types.
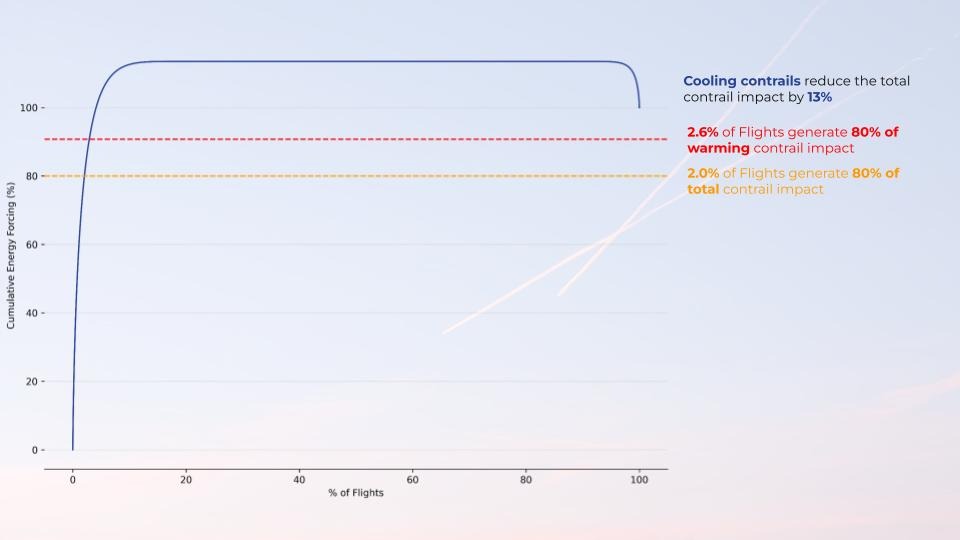
Where Airlines Should Focus First
Not all skies are created equal. Some regions, altitudes, and flight paths generate vastly more contrail warming than others. The path to effective mitigation lies in the extreme concentration of contrail impact. Rather than a global challenge requiring constant adjustments, warming is clustered within specific geographic hotspots, narrow altitude bands, and long-haul trajectories.
By identifying these high-impact "big-hit" days and off-peak periods, airlines can move from broad estimates to surgical, high-ROI interventions that maximize climate benefits with minimal operational disruption.
But not all airlines face the same opportunity…
The climate impact of an airline is defined by its network density, fleet technology, and flight timing. Some carriers operate fleets that generate disproportionate contrail warming, while others fly routes through climate-critical airspace during high-impact seasonal windows. This creates varied levels of exposure to upcoming regulations and different priorities for mitigation. Ultimately, effective strategy comes down to knowing exactly where your trajectories stand.
The opportunity in numbers
In a year of millions of flights across European airspace, the overwhelming majority of warming comes from a tiny fraction. This extreme concentration means aviation doesn't need to change everything to make massive climate progress, it needs to change the right things. Here's what the data reveals:
The Solution Is Simpler Than You Think
Avoiding contrail-forming regions doesn't require new aircraft or breakthrough fuels. It requires small vertical deviations, climbing or descending by 600-1200 meters (2000-4000 feet) on targeted flights.
These aren't massive route changes. They're minor altitude adjustments that fit within normal air traffic management procedures, especially during low-traffic periods when airspace flexibility is highest.
Contrail Opportunity Index
The 2026 Contrail Opportunity Index provides a flight-by-flight audit of the global fleet, moving beyond theoretical models to provide airlines with the specific metrics required for the current regulatory environment. Below are the 4 core diagnostic pillars we use to evaluate an airline's climate exposure and mitigation potential.
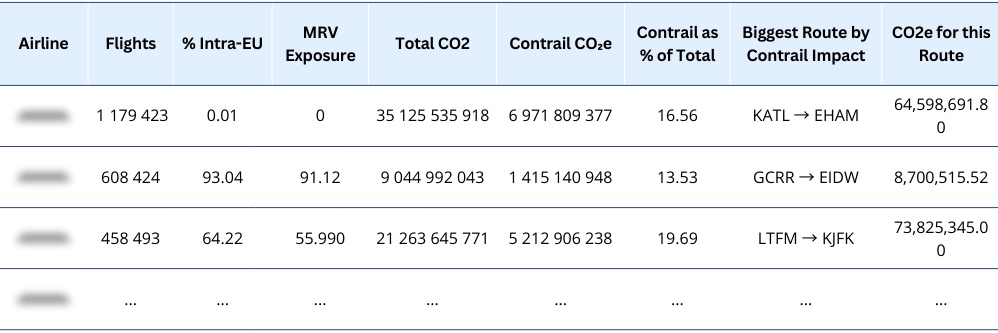
1. Flights Intra-EU & MRV Exposure
You’ll find an analysis of your flight volume subject to European monitoring compared to your global operations.
- Why it matters: With the March 31st MRV deadline fast approaching, understanding your percentage of covered flights is the first step in quantifying your immediate regulatory workload and data verification needs.
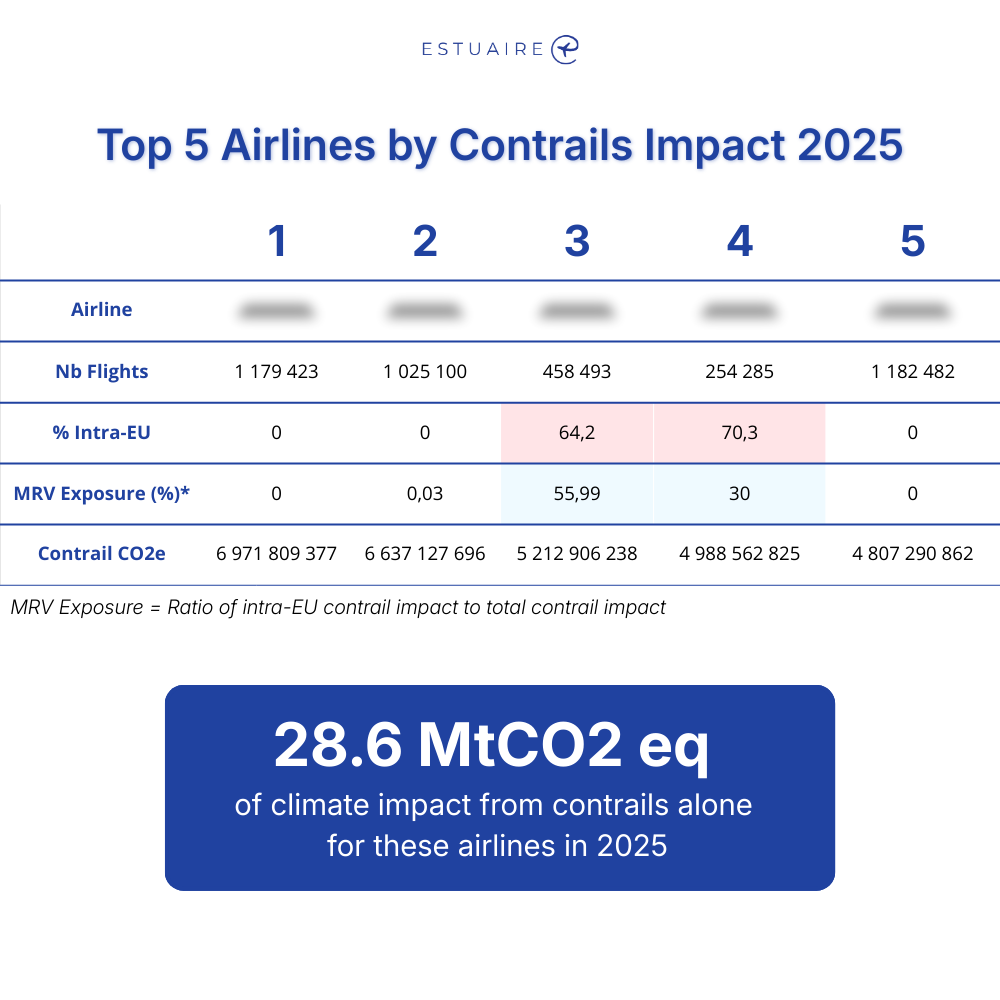
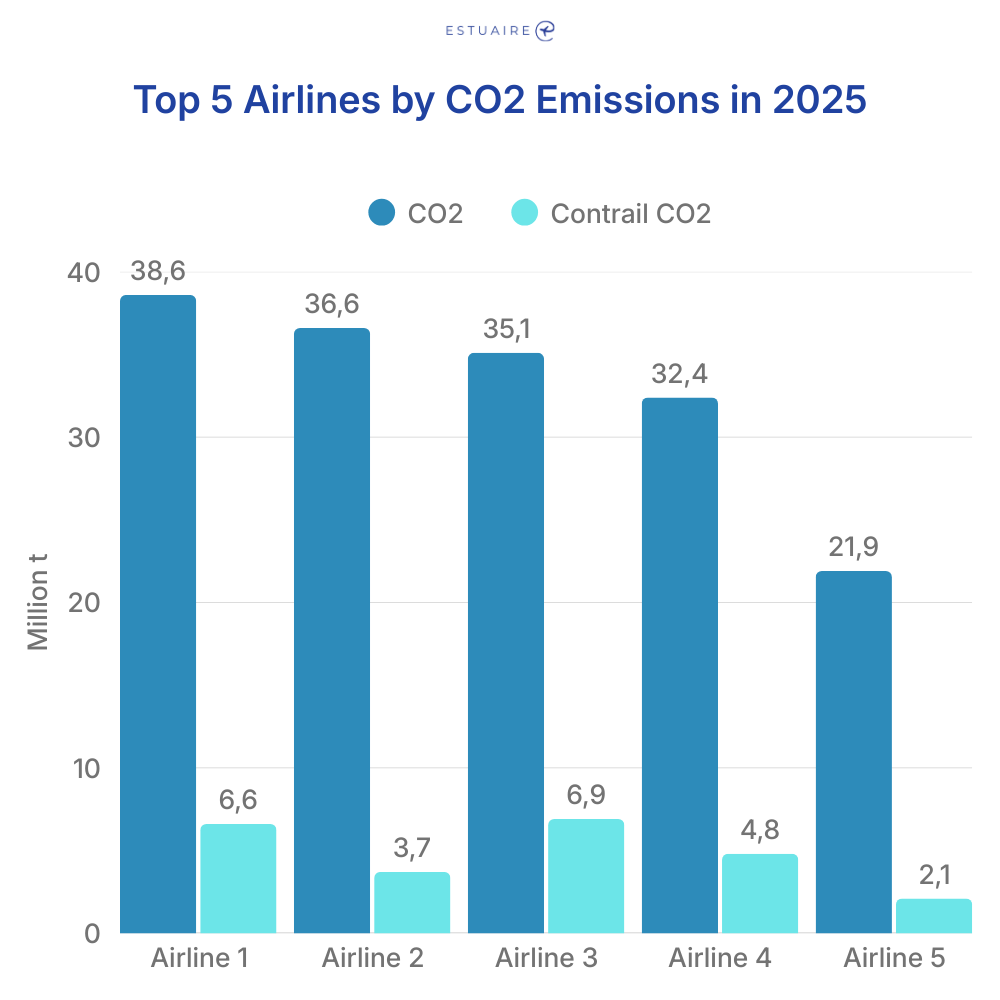
2. CO2 Emissions
That’s the absolute tonnage of direct CO2 emissions across your analyzed fleet for the 2025 period. It provides airlines a benchmark to measure the efficiency of their fleet and engine performance against industry peers within the same network categories.
- Why it matters: Direct emissions remain the core of any climate strategy. You cannot accurately manage non-CO2 effects without a precise, trajectory-based CO2 baseline.
3. Contrail CO2e
It’s a calculation of the warming impact from contrails, expressed in CO2 equivalent CO2e, and its ratio relative to your direct emissions.
- Why it matters: This is the hidden part of your footprint that evolutions brought to the ETS may bring into the financial balance sheet. In some cases, this number can significantly alter an airline’s perceived climate efficiency. Your 'Contrail as % of Total' shows the scale of your challenge. It tells you if focusing on just a few flights is enough to meet your goals or if you need a fleet-wide approach, allowing you to balance SAF for CO2 with operational avoidance for contrails.
4. Route-Specific Impact
An identification of the single flight corridor in your network where atmospheric conditions and flight frequency create the highest warming concentration.
- Why it matters: It proves the 80/20 rule. Often, a few specific long-haul routes during certain seasonal windows generate a massive share of an airline's total contrail impact. This is the most actionable data point for Flight Ops. Instead of changing every flight, you can adjust altitudes or timing on just this high-impact route to achieve an outsized reduction in your total footprint.
Inside the Index:
Here's a preview of what you'll find in the full index:
Ready to See Where You Stand? Download the full Contrail Opportunity Index here.
Let’s talk about your opportunity
If you want to understand what your ranking means for strategy and discuss how to align your operations with upcoming EU Climate Policies, reach out to the team:
- Maxime Meijers, Co-founder - CEO at Estuaire
- Erin Smith, Senior Business Manager
.png)
Contrails are essentially human-made clouds of ice. These white lines form when the hot, moist exhaust from a jet engine hits the freezing air at high altitudes, no different than seeing your breath on a cold winter day.
While these white streaks are a common sight, their actual impact on our climate is a complex subject that often leads to more questions than answers. The Estuaire Knowledge Hub is here to bridge that gap with direct, data-driven insights.
- Why are some contrails bad for the environment?
Contrails trap outgoing thermal radiation (heat) that would otherwise escape into space. When they persist and spread into "contrail cirrus" clouds, they create a net warming effect known as radiative forcing. In many cases, the warming impact of an airline's contrails can be equal to or bigger than its total CO2 emissions.
- How long does it take for a contrail to dissipate?
Dissipation depends entirely on atmospheric conditions. In dry air, contrails vanish within seconds or minutes. However, in ice-supersaturated regions (ISSRs), they can persist for several hours and evolve into man-made cirrus clouds that cover thousands of square kilometers.
- Why do some jets have contrails and some don't?
For a contrail to form, the air must be very cold (below -40°C) and moist. Because atmospheric conditions change every few hundred feet, one plane might be flying through a "dry" patch of air while another just slightly higher is in a "wet" patch, causing one to leave a trail and the other to remain invisible.
- Where does 90% of global contrail warming go?
While we track air temperature, over 90% of the Earth's excess heat trapped by greenhouse gases and contrails is absorbed by the oceans. This makes ocean heat content the most accurate bulk measure of the planet's warming.
.png)