Planes can change their route to avoid creating contrails, the white lines in the sky that warm the climate. But how much of this avoidance really happens in actual flights?
Estuaire is working with partners on a framework to evaluate contrail avoidance in operations. The aim is to bring objectivity to previously subjective metrics. The focus is on how well avoidance is integrated into operations, not on scientific uncertainty.
For airlines, the framework turns a trial into a set of operational decisions: when to optimize a trajectory, which operational constraints to revisit, which flights to target, and how a contrail avoidance strategy compares with others before scaling up.
This article presents the framework: the reference it measures against, the four factors it uses, and how they combine into a final mitigation figure that can be compared across avoidance strategies.
What do we measure against?
Evaluating a trial raises a simple question: what do we measure against?
Because we can’t directly observe the warming of a single contrail, our baseline is a model estimate. CoCiP (Contrail Cirrus Prediction model), a widely used contrail model, takes forecast or reanalysis weather data and calculates each contrail’s energy forcing for a flight, which is then converted into climate impact.
Energy forcing is the radiative effect of a contrail integrated over its lifetime and the area it covers. Expressed in Joules per metre of flight distance, it shows where along a trajectory a flight would form warming contrails, and how strongly warming it is.
In this framework, the impact of the original flight plan is evaluated using a weather forecast and the impact of the flown trajectory is assessed using reanalysis weather or the latest weather forecast available during flight. The framework assumes that CoCiP combined with weather models provide reliable impact estimates. Thus the framework measures how well avoidance fits into operations, not how accurate the weather model is.
Model uncertainty is a separate question. Contrail persistence can be verified directly on satellite imagery, but persistence alone says nothing about climate impact. Estuaire is developing methods that bridge this gap by combining what we can observe with what models predict, and this work extends into nowcasting.
The framework: four factors from flight plan to flown trajectory
We start from the contrail impact of the original flight plan (OFP): the most that could be avoided. Four factors then reduce how much is actually avoided once the aircraft has flown. Each factor is an efficiency η, between 0 and 1, that describes how much reduction is kept at that step


Because each factor is measured separately, each can be improved and compared separately. A change in operational constraints, in the flight planning process, in forecast quality or in flight execution moves one factor, and its effect on final mitigation can be calculated.
Each factor, step by step
1. Optimisation (ηoptimisation)
In flight trajectory optimisation, contrail impact is balanced against other factors such as fuel burn, overflight charges and time. Contrails are not avoided at all costs. Operational constraints, such as vertical-only rerouting and capped altitude changes, further limit what is achievable.
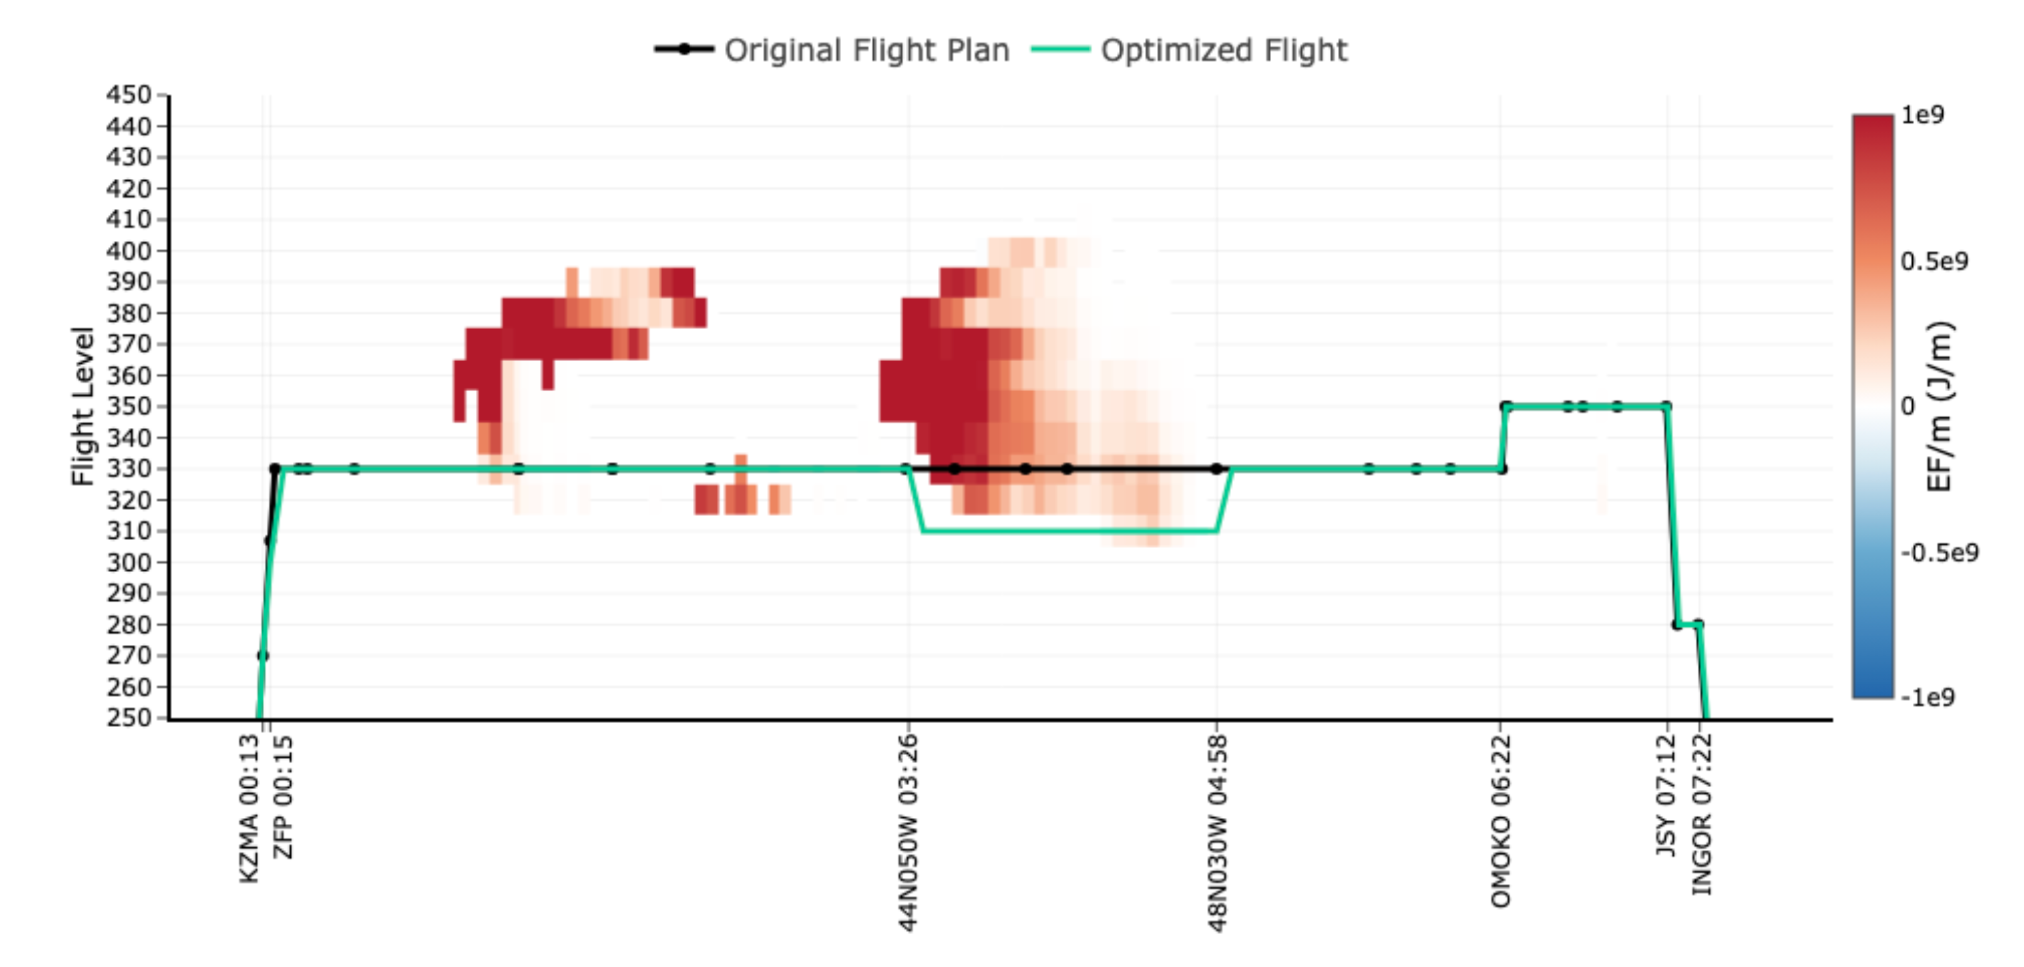
In the breakdown above, this step sets the intended mitigation at 68% of the full potential. It is partly a design choice: loosening a constraint raises the factor, and the framework measures by how much.
2. Integration (ηintegration)
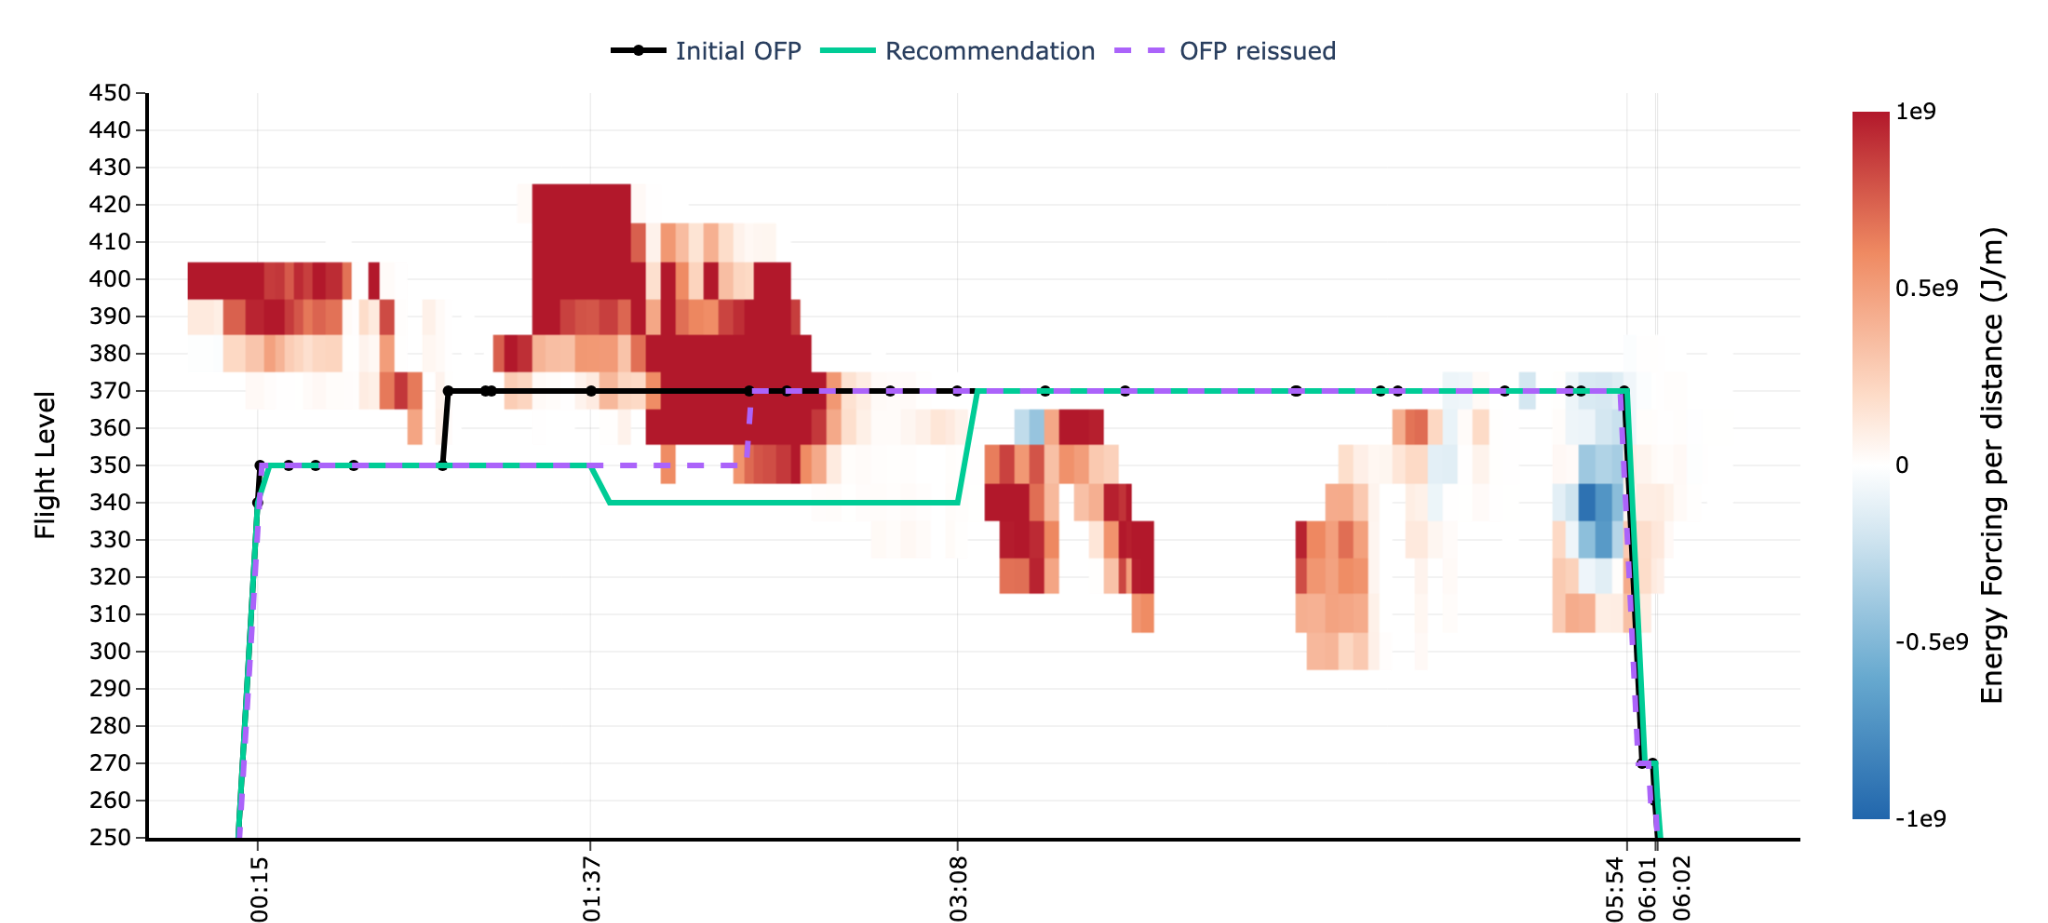
An optimised trajectory is not yet a flight plan. When a new flight plan is filed, it does not always follow the optimised trajectory exactly, due to compatibility limits of the airline's Flight Planning Software (FPS), flight plan format constraints and ATC (Air Traffic Control) filing requirements. Part of the planned mitigation is lost before take-off. In the breakdown above, integration removes 9% of the full potential.
3. Lead time (ηlead time)
Flight profiles are optimised on a weather forecast issued hours before departure. Forecast accuracy affects which flights are identified as avoidance candidates, and whether the recommended trajectory avoids the contrail-forming region.
The example below shows the same flight on the forecast and on reanalysis. The contrail-forming regions are qualitatively similar, but energy forcing is lower in the latest forecast.
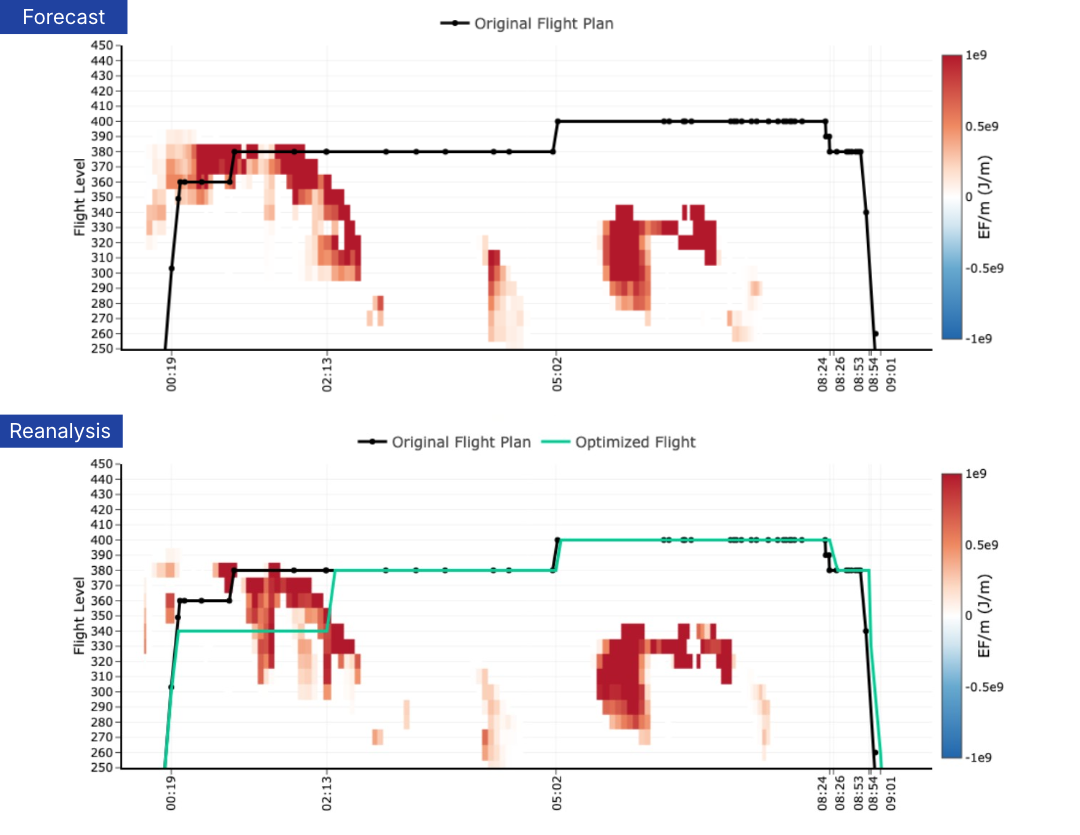
In the breakdown above, the difference between the forecast and the reanalysis weather removes 6% of the full potential. This is the factor that answers the forecast question: a forecast that is more stable and closer to reanalysis data raises ηlead time, and the gain in final mitigation can be quantified.
4. Operations (ηoperational)
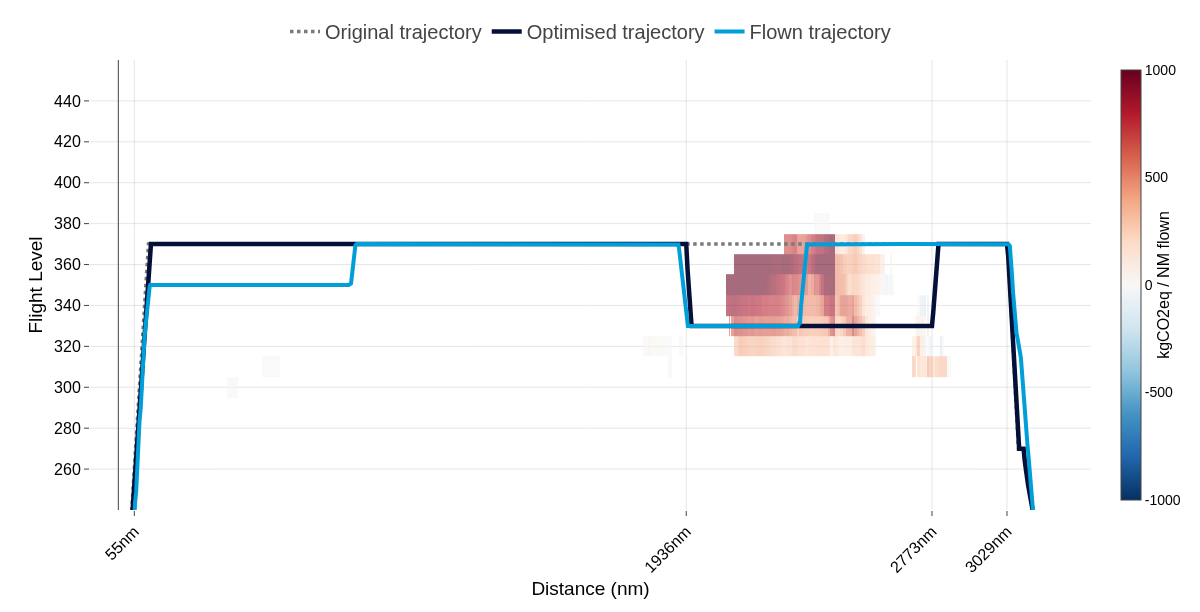
In flight, the trajectory actually flown can differ slightly from the optimised one. Pilots continuously adapt to real conditions, such as ATC instructions, weather or traffic, and departure times can shift. These normal adjustments can bring the aircraft into regions with higher contrail impact, so part of the planned avoidance is lost. In the breakdown above, this removes a further 3% of the full potential.
Final mitigation as flown
The final mitigation is the contrail reduction achieved as flown. It is measured by comparing the original flight plan with the flown trajectory on reanalysis weather data. Reanalysis is the best available reconstruction of the atmosphere after the fact, so it provides a consistent reference for every flight. In the breakdown above, final mitigation reaches 50% of the full potential.
Next steps to improve efficiency
For airlines running contrail avoidance, the framework shows which part of the operations limits the reduction in contrail impact and what can be improved. Areas of improvement cover:
- Optimisation and constraints: adapting operational constraints, such as allowing lateral rerouting or wider altitude deviations.
- Integration: computing climate-optimal trajectories that account for ATC rules from the start and are compatible with existing flight planning softwares
- Lead time: using more stable & accurate weather forecasts (better matching reanalysis), updating recommendations closer to departure, and developing nowcasting and in-flight updates.
- Operational: briefing dispatch and crews on the avoidance recommendation, following precisely planned recommended trajectory changes, sending tactical updates to pilots to account for position updates and re-optimising trajectories when departure times shift.
Because each factor is measured separately, the effect of every change can be tracked from one trial to the next. Over successive trials, this shows which measures bring the largest gains and where to focus next. Results are reported with the same method each time, which supports internal decisions on scaling up and external communication on non-CO2 mitigation.
For now, the framework focuses on airline-led avoidance, where the airline modifies flight plans before departure. We plan to extend it to Air Navigation Service Provider-led avoidance and other concepts of operations, where losses can appear at different points in the chain.
If you’re an airline planning or running a contrail avoidance trial, feel free to use the framework, or reach out to our team to talk about how it applies to your operation.

How is a contrail avoidance trial evaluated?
A trial is evaluated by comparing the contrail climate impact of the original flight plans with that of the flown trajectories. Estuaire's framework breaks the difference down into efficiency factors.
Why is there no ground truth for contrail warming?
The warming caused by a single contrail cannot be measured directly. Climate impact is therefore estimated with a contrail model such as CoCiP, using forecast or reanalysis weather data.
What is energy forcing?
Energy forcing is the radiative effect of a contrail integrated over its lifetime and area. CoCiP calculates it for each contrail, and it is then converted into climate impact.
Can satellite imagery verify contrail avoidance?
Satellite imagery can verify whether persistent contrails formed. Persistence alone says nothing about climate impact, which is why Estuaire combines observations with model predictions.
How does weather forecast accuracy affect contrail avoidance?
Forecast accuracy determines which flights are selected as avoidance candidates and whether the recommended trajectory avoids the correctly located contrail-forming region. In the framework, this is captured by the lead time factor.
What is the difference between airline-led and ANSP-led contrail avoidance?
In airline-led avoidance, the airline modifies flight trajectories to avoid contrails. In ANSP-led avoidance, air navigation service providers restrain sector usage to adapt aircraft trajectories in the airspace and reduce their contrail impact.